Open science
for the benefit of all.
Data, models and tools built in the open, with anyone, for everyone.
Why it matters
Genetic research should include everyone.
A genetic difference common in one community can be rare in another. Yet most people in genetic studies so far have European ancestry. We learn from humanity’s diversity, so discoveries serve everyone, including communities research has left out.
Populations with the greatest genetic diversityare the least represented in research.
- 86European ancestry
- 13All other ancestries, or not recorded
- 1African ancestry
Source: GWAS Catalog, July 2021, in Fatumo et al., Nature Medicine, 2022 . A person in several studies is counted in each.
How it works
Three steps, all in the open.
Gather and harmonize
We collect genetic data from research papers and our community, welcome university and industry partners, and put it into one format. AI agents that read the research are coming.
Build AI models
Models learn from real measurements to estimate what hasn’t been measured yet, and show how sure they are.
Explore the genomeOS Atlas
Anyone can see the results on a free, interactive globe.
Our flagship project
A growing map of human genetic variation.
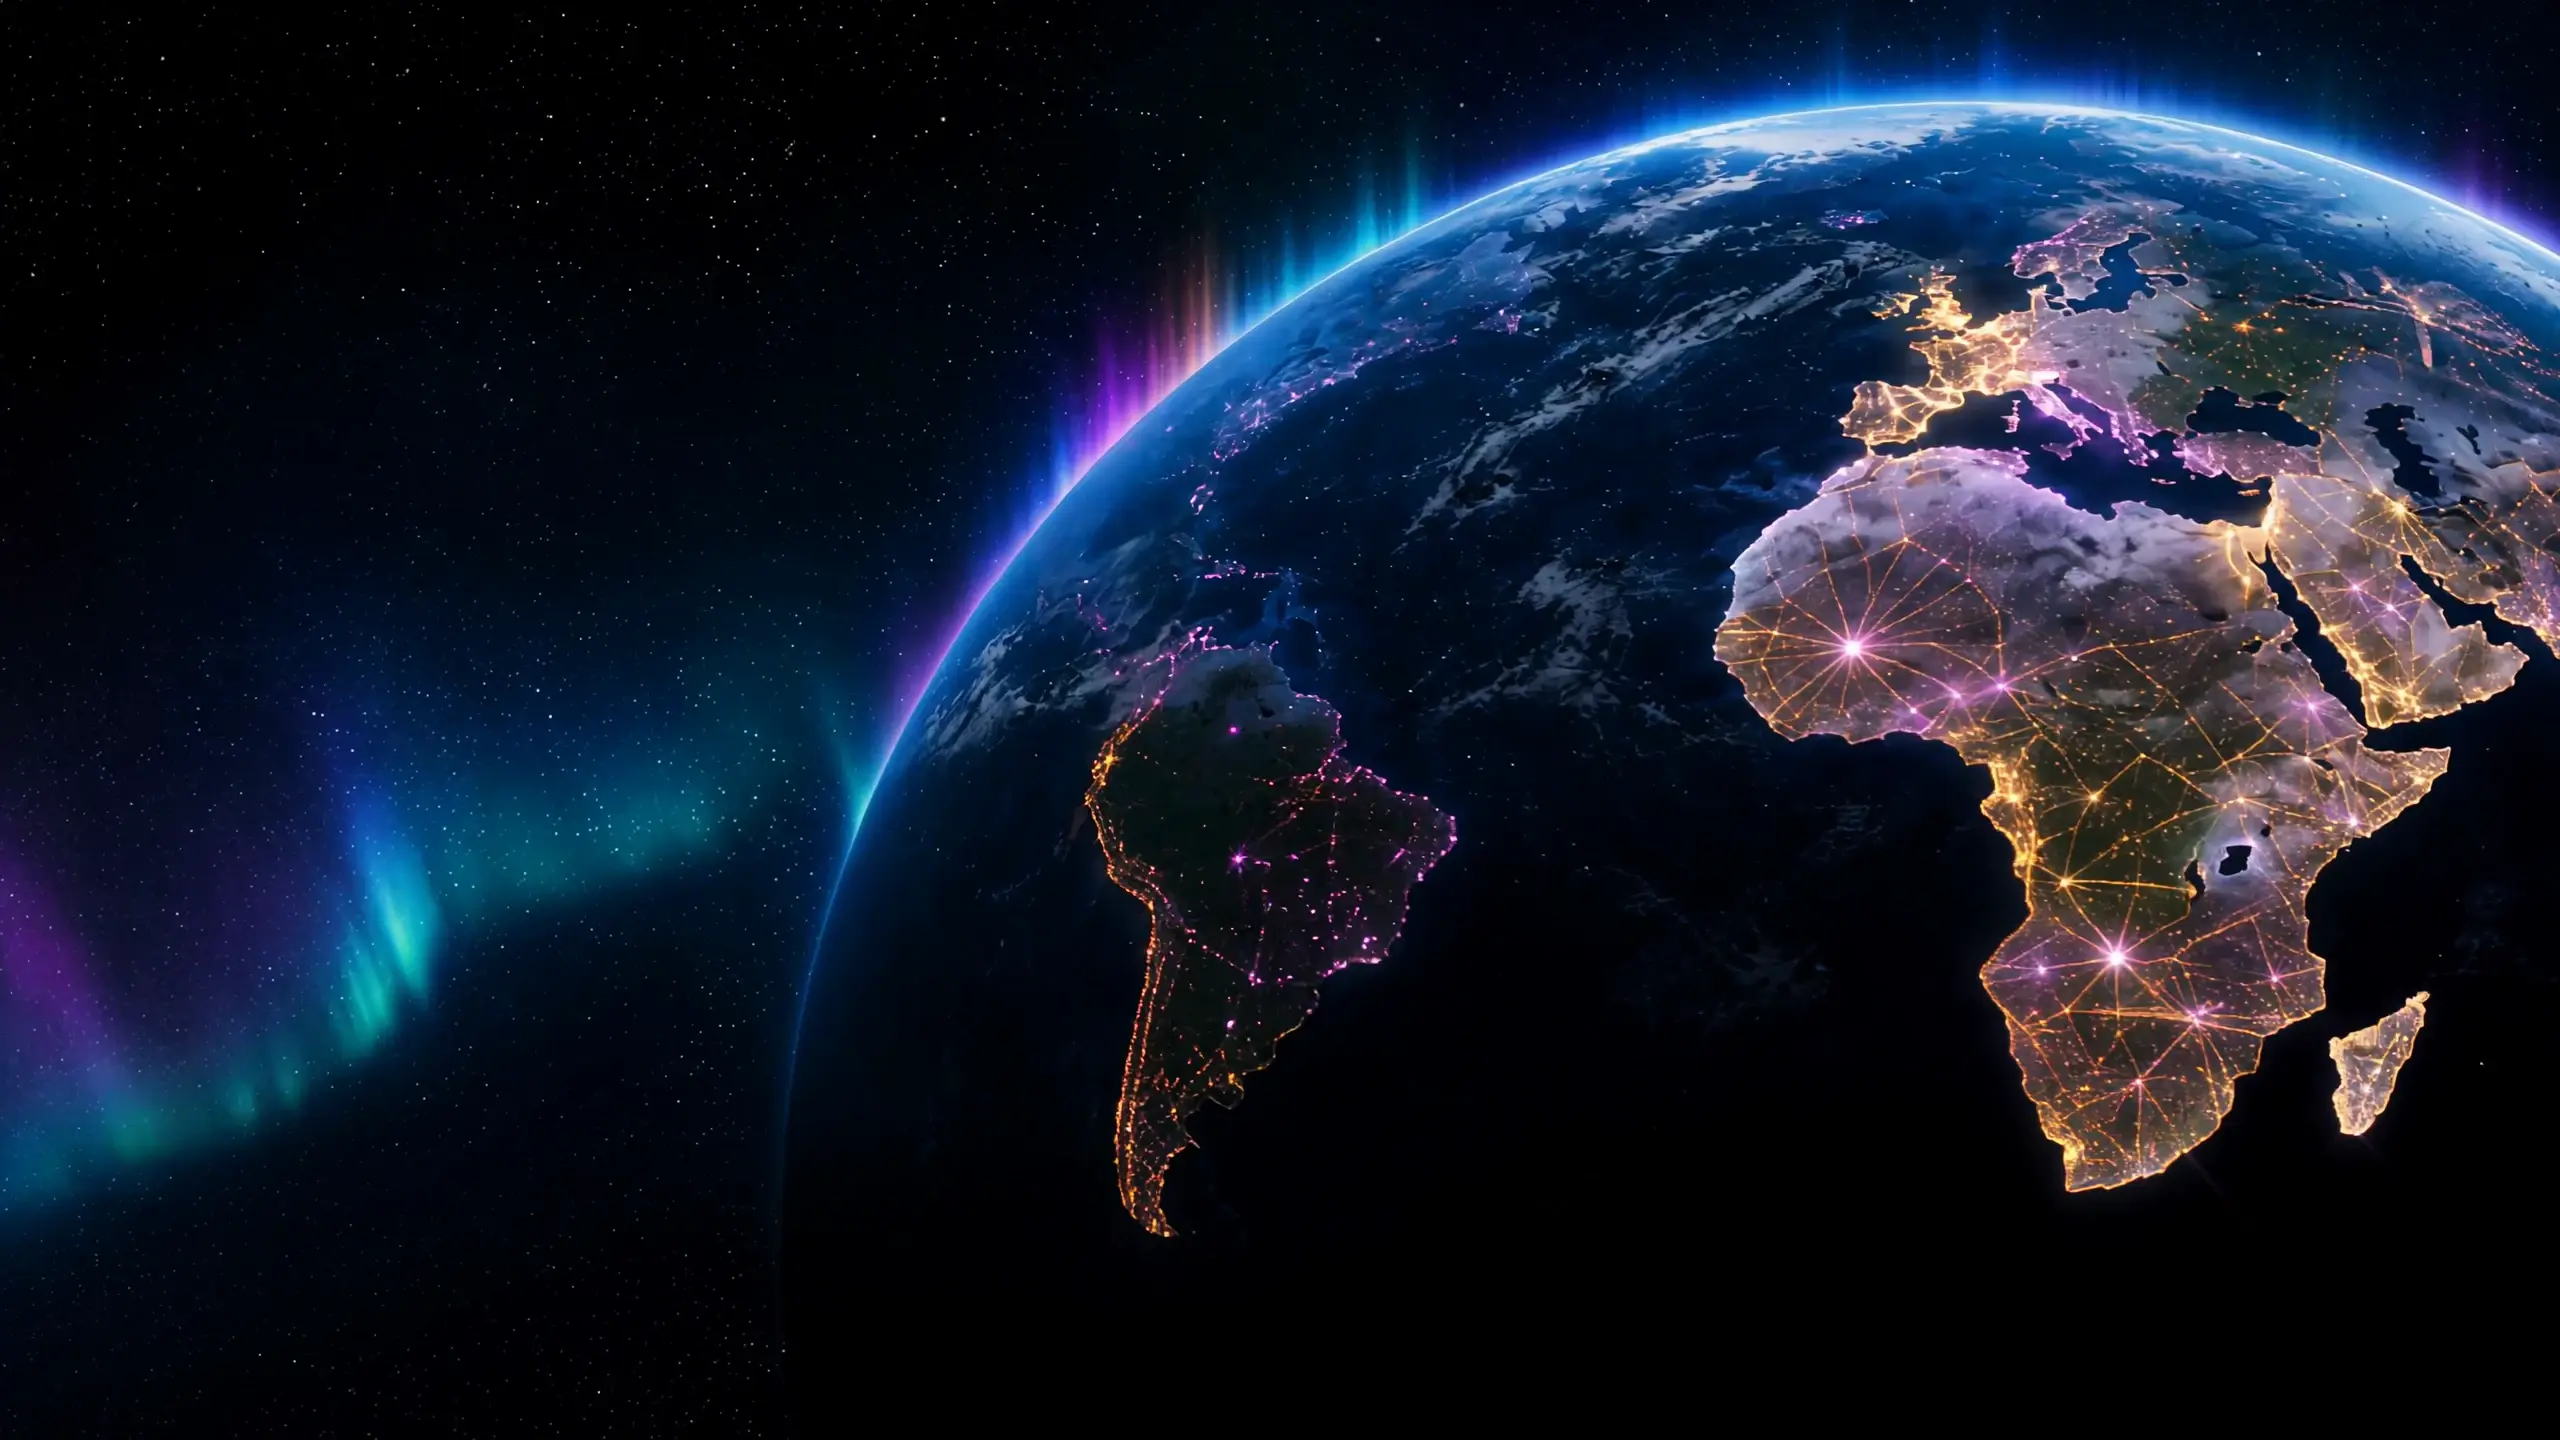
The genomeOS Atlas shows how common genetic differences are around the world, where data are still missing, and how sure we are. Spin the preview, then explore the real thing.
Read about our projects
Arrow keys turn the globe; Home returns it to its starting view. Focus pauses it.
- Measured: 9,506 people tested, at 7.4°N 3.9°E.
- Modeled: about 2.8%, likely 1.3–6.1%, at 23.1°N 20.9°E.
- No estimate: no survey in range, at 50.0°N 60.8°E.
A simplified preview, made from a sample of real Atlas data.
Open the genomeOS AtlasHbS (rs334) · model v3 · data map-2026-08 · revision 6e77ef2 · coarsened for display
View as table
| Area center | Modeled | 95% range across the area | Nearest survey |
|---|---|---|---|
| 8.4°S 17.5°E | 16% | 7.2–28% | 95 km |
| 10.2°S 15.0°E | 14% | 4.8–28% | 191 km |
| 7.2°S 14.8°E | 14% | 6.3–28% | 206 km |
| 6.6°S 20.0°E | 14% | 6.6–25% | 167 km |
| 5.4°S 17.2°E | 14% | 7.5–25% | 123 km |
| 1.7°S 22.1°E | 13% | 5.1–26% | 280 km |
| 7.0°N 6.1°E | 13% | 6.8–21% | 78 km |
| 9.9°N 12.2°W | 13% | 4.2–25% | 164 km |
| 5.3°N 4.3°E | 13% | 6.8–22% | 79 km |
| 3.6°S 19.7°E | 13% | 6.4–23% | 321 km |
| Distance to the nearest survey | Share of model cells |
|---|---|
| Survey within 170 km | 17.4% |
| Within 680 km | 41.7% |
| Within 1,361 km | 19.7% |
| No estimate | 21.2% |
Measured surveys: 1,071
Join us
You don’t need a PhD to help.
We’re a hacker collective doing open-source citizen science.
All skillsets and backgrounds are welcome: coding, writing, healthcare, graphic design, fundraising, business strategy, or just a strong curiosity and desire to do good for the world. We’ll find a place to fit your expertise and interests.