
Screening programs
First release
Where carrier screening would help most.

Projects
One project is live. Many more can start with you.
Live, in development
Scattered genetic data, placed and modeled on one open map.
Next project
More to come
Every project starts as a community idea. Share an idea
Project 1
Where a genetic variant is common shapes who is offered screening, how a test result is read and where a study can recruit.
The Atlas maps variants on an interactive globe. Pick one, inspect any place and see where evidence is thin.
Open the genomeOS Atlas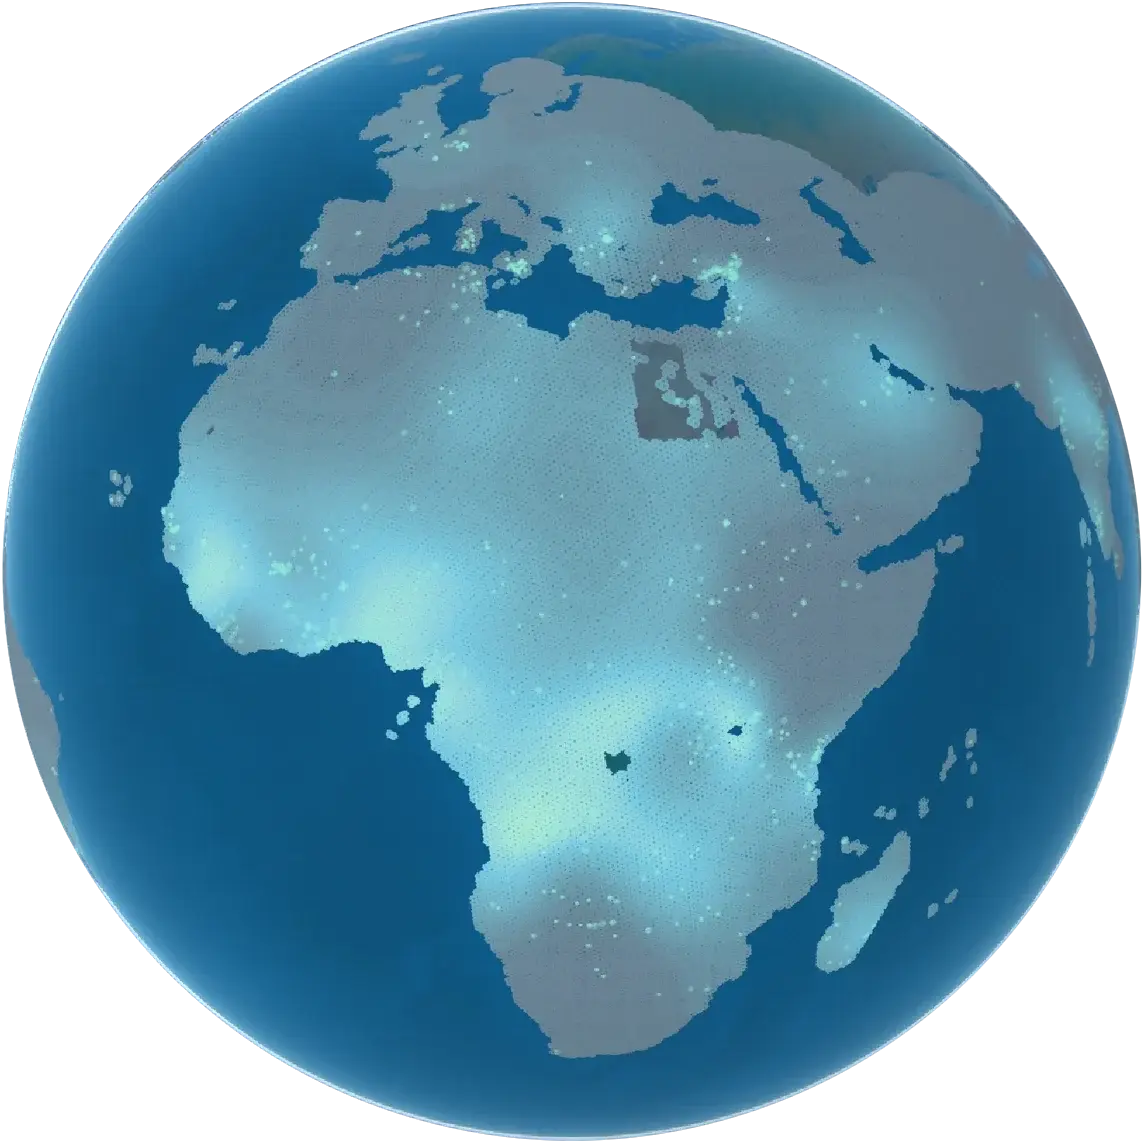
Variant total: 4,391 identifiers from the Allele Frequency Net Database (AFND) after the current quality filters, plus the hemoglobin S variant associated with sickle-cell disease (also known as HbS or rs334). Participant total: each retained database population sample counted once, plus people tested in the retained hemoglobin S surveys and male participants in the retained glucose-6-phosphate dehydrogenase (G6PD) deficiency surveys. Some studies may include overlapping groups, so this total describes the scale of the collected evidence rather than a verified census of unique individuals.
Recomputed 2026-09-06 from source snapshot fc17bc1c1d96a0d0766746dcf26277ccdc669717, last updated 2026-08-27.
One copy can protect against severe malaria; two cause sickle-cell disease. Its frequency traces biology, environment and history.
Arrow keys move a reticle over the map, and the readout below describes the area under it. Home returns to the centre; Escape clears it.
241 confidently above, 622 possibly above
Simplified from the Atlas’s HbS data.
See it live in the AtlasExpected share of births, from the modeled frequency
HbS (rs334) · model v3 · data map-2026-08 · revision 6e77ef2 · coarsened for display
| Share of births | Confidently above | Possibly above | Below, muted |
|---|---|---|---|
| 85% or more | 2,959 | 765 | 496 |
| 90% or more | 2,263 | 1,063 | 894 |
| 95% or more | 1,477 | 852 | 1,891 |
| Share of births | Confidently above | Possibly above | Below, muted |
|---|---|---|---|
| 5% or more | 774 | 1,106 | 2,340 |
| 10% or more | 241 | 622 | 3,357 |
| 15% or more | 18 | 435 | 3,767 |
| Share of births | Confidently above | Possibly above | Below, muted |
|---|---|---|---|
| 0.1% or more | 611 | 921 | 2,688 |
| 0.5% or more | 68 | 520 | 3,632 |
| 1% or more | 0 | 277 | 3,943 |
First release
Where carrier screening would help most.
Future exploration
Regional context before a genetic test.
Where a study could find enough carriers.
Where the next sample matters most.
Future exploration
Variants that change a dose.
Patterns worth testing.
| Source record | Place ± radius | allele count | alleles tested | Allele orientation | Recruitment | Reuse terms | Outcome |
|---|---|---|---|---|---|---|---|
| City sample | present | present | present | present | present | present | Placed. Every field present; a small stated radius. |
| National survey | present | present | present | present | present | present | Placed, country-wide. Every field present; a radius as wide as the country. |
| Continental group | not a place | present | present | present | present | present | Context only, not a place. Its location is an ancestry label, not a place. |
| Paper table | present | missing | missing: refused | not reached | not reached | not reached | Refused: no count. A percentage with no allele count and no alleles tested. |
| Unplaced label | missing: the build fails | not reached | not reached | not reached | not reached | not reached | Build fails: no place. A population label with no coordinate. |
Every observation needs a place, a radius and a count.
Zero is weak evidence, not absence. Each person carries two copies of the gene; the Atlas counts copies.
Survey 1: 58 of 206 people tested carry the variant: 55 with one copy and 3 with two, 61 of their 412 gene copies. Plausible share of carriers 22.3 to 34.6 percent.
Survey 2: none of 10 people tested carry the variant. Plausible share of carriers 0 to 21.7 percent.
Illustrative surveys; 95% Jeffreys intervals.
| Survey | People tested | Carriers | Gene copies with the variant | Plausible share of carriers (95%) |
|---|---|---|---|---|
| Survey 1 | 206 | 58 (55 with one copy, 3 with two) | 61 of 412 | 22.3–34.6% |
| Survey 2 | 10 | 0 | 0 of 20 | 0–21.7% |
| Survey 2 | 20 | 0 | 0 of 40 | 0–11.7% |
| Survey 2 | 50 | 0 | 0 of 100 | 0–4.9% |
| Survey 2 | 100 | 0 | 0 of 200 | 0–2.5% |
| Survey 2 | 200 | 0 | 0 of 400 | 0–1.2% |
| Survey 2 | 500 | 0 | 0 of 1,000 | 0–0.50% |
How the pipeline works
Published samples become counted observations. Counts go straight to the Atlas as measured points; separately, an offline model turns them into a modeled surface with uncertainty. The two arrive as separate layers.
A population-location registry places every observation. Counts go straight to the data service and the map as measured points; separately, frequency and disease-burden models turn them into modeled estimates that pass a validation gate before the data service. The two arrive at the map as separate layers.
Select a part to read its contract.
Separate tables, layers and legends.
Too little evidence is hatched, never colored.
A coarse cell stays one cell.
No convenient defaults for places, recruitment or denominators.
Single-variant conditions and drug response only.
A blank beats a plausible guess.